Cost and schedule overruns have become a common reality among large-scale industrial projects. France's Flamanville 3 nuclear reactor is a striking example. Originally estimated at €3.3 billion when construction began in 2007, the project's final cost climbed to roughly €13.2 billion, about four times its original budget, and the reactor connected to the grid in late 2024, some 12 years behind its original target.
No project manager wants to be at the helm of projects that stray off their course. When faced with these difficulties, project professionals rely on strong project management processes to resolve problems. Earned value management is one of these tried-and-true methods that can help project managers navigate any bumps in the road.
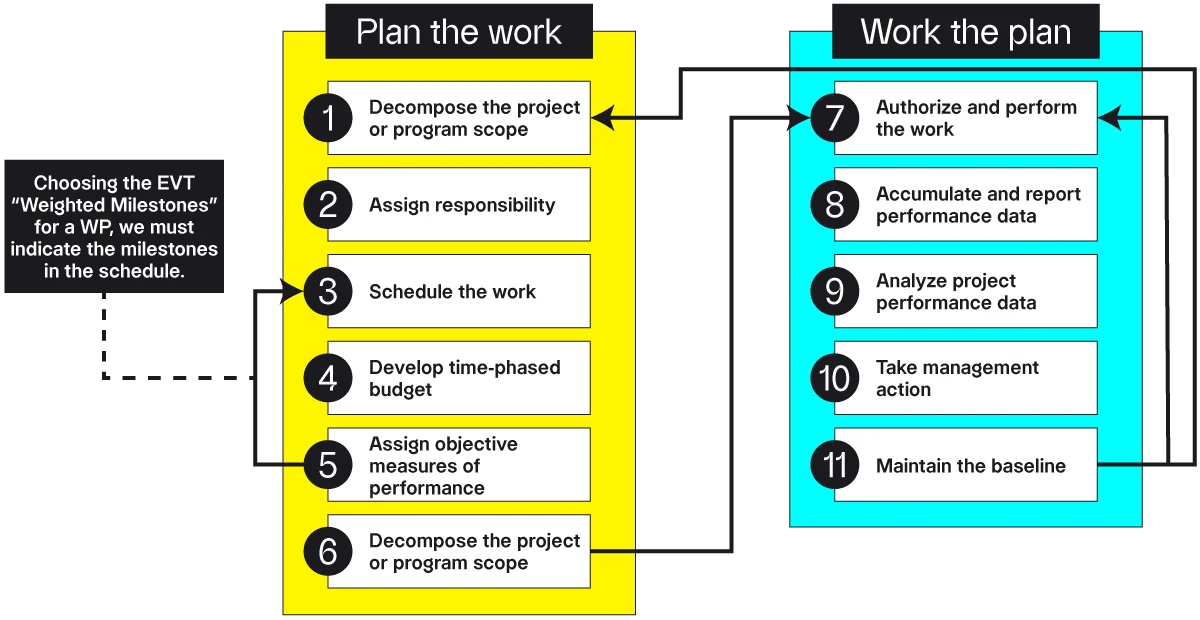
Earned value management (EVM) is a project management methodology that integrates schedule, costs and scope to measure project performance. Based on planned and actual values, EVM predicts the future and enables project managers to adjust accordingly.
In turn, Earned Value Management Systems (EVMS) refer to the software, processes, tools and templates used for EVM.
Another important term used in this context is earned value analysis (EVA). EVA is a quantitative technique used to evaluate project performance by analyzing schedule and cost variances.
EVM uses EVA as one of its tools but is larger in scope. While EVA stops with the compute portion, EVM is all about using that data in trends analysis and forecasting. EVM is a project management function that addresses both the data and the actions taken in light of it.
The origins of EVM
EVA, EVM and EVMS have a fascinating origin story. In the 1960s, The U.S. government drafted 35 criteria for contractor management systems to follow. Later in the 1990s, the American National Standard Institute (ANSI) and the Electronic Industries Association (EIA) developed these into 32 guidelines for EVMS, resulting in the ANSI/EIA 748 standard. For technology systems used in several U.S. government agencies such as the Department of Defense (DoD) and National Aeronautics and Space Administration (NASA), this has now become the gold standard.
At the same time, implementing EVM does not require the EIA 748 standard. All those criteria and the rules around them have contributed to a perception that EVM is difficult and onerous. The good news is that EVM metrics are straightforward and you can implement your EVM process with as much or as little rigor as your particular projects require.
Benefits of earned value management
According to research popularized by Fleming and Koppelman, once you're 20% into a project, you can use current performance to predict the final outcome within a plus or minus 10% deviation. EVM makes this predictive capability possible, making it one of the best project cost control measures available.
Earned value management offers many benefits, enabling you to:
Map work with costs, reducing unknowns into quantifiable factors.
Compare and benchmark the current status against the project baseline and identify critical paths.
Create a data-based framework to take actions and make decisions for the future.
Intervene fast and ahead of time (for example, you can tweak project scope and budgets, rollback functionalities, procure more resources, invest in better technologies, set customer expectations, pivot resources, etc.).
Promote enhanced visibility and create accountability in stakeholders through clear metrics.
Provide insight into the big picture at both project and portfolio levels.
Earned value management core concepts
EVM can be intimidating to some project managers, due to the many terminologies associated with it. EVM involves several core concepts, each building on the last. We'll also provide a list of the most important EVM formulas for reference below. Each of these concepts plays a key role in improving project performance.
Planned value (PV)
Planned value is the budgeted cost for work scheduled (BCWS). PV varies based on the scope of work in consideration and the point where you're at in the overall schedule.
PV = Total project cost * % of planned work
For example, let's say, the PV for your 5-month project is $25,000:
PV for the complete project = $25,000
PV at 2 months = $25,000 * 40% = $10,000
You can also calculate PV for a time period, say, month 2 to month 4 = $25,000 * 60% = $15,000.
Actual costs (AC)
Actual costs, also known as actual cost of work performed (ACWP), is relatively straightforward. If you are using a robust project cost management software, tracking actual costs should not be a challenge. However, it's important to remember to include several hidden costs: material, resource, hardware, software licenses, overheads, etc.
You can look at AC cumulatively, accounting for all the activities done from the beginning of the project to date or over a specific time period.
In our example, let's assume, AC at the end of 2 months = $15,000
Earned value (EV)
You've made a plan to complete a certain amount of work and budgeted accordingly. But, from experience, you know that there is bound to be some discrepancy from your estimate. At the end of 2 months, you may have planned to complete 40% of your work, but let's say you only managed to finish 30%.
The question, then, is, what's the budgeted cost for this work? EV, also referred to as budgeted cost for work performed (BCWP), gives you the answer.
In our example:
EV = Total project cost * % of actual work = $25,000 * 30% = $7,500
Variance analysis
Planned value, actual cost and earned value numbers are essential to variance calculations. At this point, the project manager wants to know how far off we are from the project baseline. Schedule and cost variance determine this.
Schedule variance (SV)
Schedule variance is a quantitative indicator of your divergence from the initial planned schedule. A negative SV indicates that we are behind schedule, a positive SV indicates that we are ahead of schedule and zero means that we are exactly on schedule.
SV = EV - PV
In our example, SV at 2 months = $7,500 − $10,000 = -$2,500
SV% = (SV/PV) *100 = (-$2,500/$10,000) *100 = -25%
This implies that we are 25% behind schedule. It's interesting to note that we aim to understand schedule, a time component, from the perspective of costs. To arrive at these costs though, we needed to know the scope of work planned and completed. This is how the three pillars – scope, time and cost – come together in EVM.
Cost variance (CV)
Cost variance is a quantitative indicator of your divergence from the initial planned budget. A negative CV indicates that we are over budget, a positive CV indicates that we are under budget and zero means that we are exactly on budget.
CV = EV − AC
In our example, CV at 2 months = $7,500 − $15,000 = -$7500
CV% = (CV/EV) *100 = (-$7,500/$7,500) *100 = -100%
This implies that we are 100% over budget.
Again, this is an instance of how scope, time and cost come together to give you a clear picture of where you currently stand in your project.
Performance indexes
Another way of looking at project performance, apart from variance, is through indexes. Here again, we have two parameters – schedule and cost index.
Schedule performance index (SPI)
SPI gives a sense of project performance from a schedule perspective.
SPI = EV/PV; SPI > 1 indicates the project is ahead of schedule and SPI < 1 indicates the project is behind schedule. In our example, SPI = $7,500/$10,000 = 0.75, indicating the project is only going 75% as per the original plan or it's 25% behind schedule.
Cost performance index (CPI)
CPI gives a sense of project performance from a cost perspective. CPI = EV/AC; CPI > 1 indicates the project is under budget and CPI < 1 indicates the project is over budget.
In our example, CPI = $7,500/$15,000 = 0.5, indicating the project expenditures are only at 50% of the plan.
Earned value management formulas
Here are the most important EVM formulas:
Planned Value (PV)
Formula: PV = Planned % Complete * BAC (Budget at Completion)
Description: The authorized budget assigned to scheduled work up to a specific point in time. Also referred to as Budgeted Cost for Work Scheduled (BCWS).
Earned Value (EV)
Formula: EV = Actual % Complete * BAC
Description: The value of work completed to date, expressed in terms of the approved budget. Also referred to as Budgeted Cost for Work Performed (BCWP).
Actual Cost (AC)
Formula: AC = Sum of Costs Incurred
Description: The actual cost incurred for the work completed to date. Also referred to as Actual Cost of Work Performed (ACWP).
Cost Variance (CV)
Formula: CV = EV - AC
Description: The difference between earned value and actual cost at a given point in time. A negative CV indicates the project is over budget; a positive CV indicates it is under budget; zero indicates on budget.
Schedule Variance (SV)
Formula: SV = EV - PV
Description: The difference between earned value and planned value at a given point in time. A negative SV indicates the project is behind schedule; a positive SV indicates ahead of schedule; zero indicates on schedule.
Cost Performance Index (CPI)
Formula: CPI = EV / AC
Description: A measure of cost efficiency. A CPI > 1 indicates cost efficiency is better than planned (under budget), while a CPI < 1 indicates project expenditures exceed the baseline plan.
Schedule Performance Index (SPI)
Formula: SPI = EV / PV
Description: A measure of schedule efficiency. An SPI > 1 indicates the project is progressing faster than scheduled, while an SPI < 1 indicates work is behind schedule.
Estimate at Completion (EAC)
Formula (Typical Variances): EAC = BAC / CPI (Used when future cost performance is expected to mirror past performance)
Formula (Atypical Variances): EAC = AC + (BAC - EV) (Used when current variances are considered anomalies not expected to continue)
Description: The expected total cost of completing all project work based on performance to date.
Estimate to Complete (ETC)
Formula: ETC = EAC - AC
Description: The expected cost remaining to finish all outstanding project scope.
Variance at Completion (VAC)
Formula: VAC = BAC - EAC
Description: The projected budget surplus or deficit at the conclusion of the project.
To-Complete Performance Index (TCPI)
Formula (Targeting BAC): TCPI = (BAC - EV) / (BAC - AC)
Formula (Targeting EAC): TCPI = (BAC - EV) / (EAC - AC)
Description: The cost performance efficiency required on remaining work to achieve a specific management goal (BAC or EAC). A TCPI > 1 means remaining work must be executed with higher cost efficiency than originally budgeted.
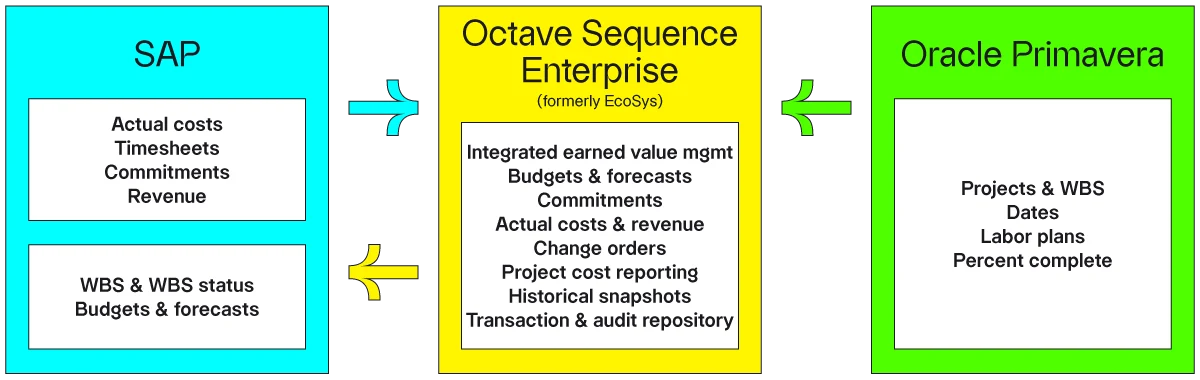
Here is a typical system landscape supporting EVM: