Earned Value Management (EVM) is a well-established methodology for measuring project progress and performance, with decades of use across major capital programs. Its early adopters include NASA and the U.S. Department of Defense, who have been using the practice extensively in critical, long-term projects with massive budgets.
Though EVM as we know it is a robust technique, it wasn't always so powerful. For years, the lens through which EVM could measure project performance was narrow. It wasn't until relatively recently that earned schedule arrived on the project management scene. Today, earned schedule is an integral component to EVM that has broadened the ways in which teams can measure project success.
Understanding earned schedule starts with three core metrics and how they expose what EVM alone cannot.
Earned schedule is a method that, as its name suggests, helps analyze project performance using units of time, rather than units of cost. By using earned schedule management (ESM)—i.e., the practice of using earned schedule to oversee a project—project managers can calculate whether a project is running on schedule. Using ESM, project managers can also visualize project progress, compute schedule delays and forecast trends with accuracy.
Walt Lipke's 2003 article " Schedule Is Different," marked the introduction of earned schedule, establishing it as a significant extension of the traditional EVM theory.
EVM is a broader project management methodology that integrates schedule, costs and scope to measure project performance. However, unlike earned schedule, EVM expresses this performance in units of cost, not time.
Specifically, EVM expresses two calculations that are integral to tracking project performance, cost variance and schedule variance, in terms of currency. This approach works well for cost variance. It makes sense to say a project is over budget by $2,000. However, for schedule variance, this gets confusing; it's more intuitive to discuss schedule variance in units of time instead. For example, it makes sense to say a project is behind schedule by four weeks rather than $4,000.
ES rectifies this issue, along with some other challenges in EVM.
Key metrics and project performance
To appreciate how ES augments traditional EVM, we first need to know the different metrics and key concepts associated with EVM and how these enable tracking project performance. Each metric plays a distinct role.
Planned value
Planned value (PV), also known as the budgeted cost for work scheduled, is how much you've allocated to spend on work at any point in the project. It answers the question: "How much are you planning to get done by X time and how much should that work cost?" It's expressed in units of currency. Here is the formula for calculating planned value:
PV = Total project cost * % of planned work
For example, say you expect to build 10 bridges in a span of 10 months with a total budget of $100,000. You plan to build one bridge per month. The PV at 10 months, when all of the bridges should be done, is as follows:
PV = Total project cost ($100,000) * % of planned work (100)
PV = $100,000 * 100%
PV = $100,000
However, the PV at four months, when four of the bridges should be complete, is different:
PV = Total project cost ($100,000) * % of planned work (40)
PV = $100,000 * 40%
PV = $40,000
Actual cost
Actual cost (AC), also referred to as actual cost of work performed, is straightforward—it's the sum of all costs you have incurred in the project so far. It answers the question: "How much have you spent at X point?" This can be more or less than the original budgeted costs, or PV.
Let's carry on with our 10-month, $100,000 bridge example, looking at costs at the four-month mark. Remember that in this scenario, the PV at four months is $40,000.
Let's now say that our AC at four months is $25,000. Looking at just the PV ($40,000) and the AC ($25,000), at first glance, it might seem like we've spent $15,000 less than we budgeted. But are we actually under budget? Well, that depends on another EVM concept: earned value.
Earned value
Earned value (EV), also known as budgeted cost for work performed, shows how much you had planned to spend on the work you've actually done at the time. It answers the question: "How much work have you done and how much was that work supposed to cost?"
The formula for EV is:
EV = Total project cost * % of actual work
To illustrate this, let's continue on with our example from above: Completing 10 bridges over the span of 10 months, at a pace of one per month, with a total budget of $100,000. We'll look again at the four-month mark, at which point we've planned to complete 40% of the work.
Now, let's say we've only completed 20% of the work. What should our EV look like?
EV = Total project cost ($100,000) * % of actual work (20%)
EV = $100,000 * 20%
EV = $20,000
Using EVM metrics
Now that we have all of our information—PV, AC and EV—we can determine how well our project is performing. We do this by calculating cost variance (CV), which is expressed in units of currency, and cost performance index (CPI), which is expressed on a scale of zero to one.
Let's look at our numbers at the four-month mark so far:
PV = $40,000
AC = $25,000
EV = 20,000
Now, let's first calculate CV; here's the formula:
CV = EV – AC
Continuing on with our bridge example, here's the CV at the four-month mark:
CV = EV ($20,000) – AC ($25,000)
CV = $20,000 – $25,000
CV = – $5,000
This negative figure shows that we're over budget for the amount of work we've done.
To put this performance on a scale, we'll need to calculate CPI. Here is the breakdown of the CPI's scale:
CPI < (less than) 1 indicates that the project is over-budget
CPI > (greater than) 1 indicates that the project is under-budget
CPI = 1 indicates that the project is on budget
And the formula for CPI is as follows:
CPI = EV/AC
So in our bridge project example, here is what our CPI at four months comes out to:
CPI = EV ($20,000) / AC ($25,000)
CPI = 20,000/25,000
CPI = 0.8
Since our CPI is less than one, we know that we're over budget. And doing a little more basic math can convert that excess into a percentage:
CPI = [(1 – 0.8) *100]
CPI = 20%
Now we know that at the four-month point of our bridge project, we're $5,000, or 20% over the budget we had planned for the amount of work we've actually done. But herein lies one of the main limitations with EVM: It shows a project's progress in units of money.
To truly understand our progress, we need to think in terms of time, too — which is where earned schedule comes in.
Earned schedule metrics
For earned schedule calculations, we also use PV, EV and AC. However, we have three additional, schedule-related metrics to consider here that are essentially equivalent to PV, EV and AC, but they're expressed in units of time instead of currency.
Planned duration
Planned duration (PD) is the total amount of time allotted for a project. It answers the question: "How long should it take to complete all of your work?"
In our bridge example, the total PD for the project is 10 months.
Actual time
Much like AC, actual time (AT) is straightforward—it's just how much time you've taken to complete work. You may have planned to complete a piece of work in two months, but the actual time taken may be four months. So then, AT = four months.
Earned schedule
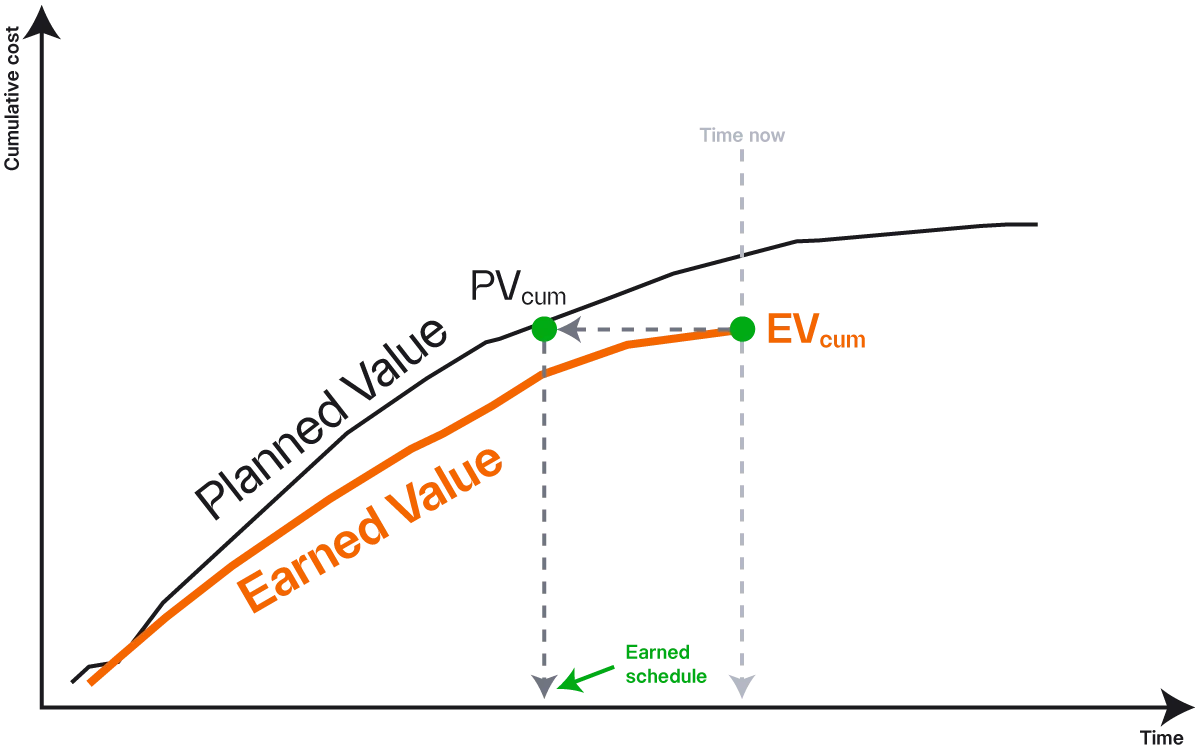
Earned schedule (ES) is how long you had planned to take to finish the work that you've actually completed. It answers the question: "How much work have you actually done and how long was it supposed to take?"
In our example, we planned to get 10% of our work done each month, i.e., build one bridge per month for a total of 10 bridges at the end of 10 months. So at the four-month mark, we'd planned to complete 40% of our work. However, we only managed to complete 20% of the work at the end of that time.
In this case, earned schedule is two months, as we were expected to complete 20% then. So your project has "earned" two months in the span of four months.
There are a couple of different ways to arrive at this figure. There is a formula for calculating earned schedule, though it can get complex. An easier way is to use a graph of the values (PV and EV) that you already have. Cost should be on the Y-axis, and time units should be on the X-axis, like this: