Underperformance is nothing new in the world of capital projects. Cost and schedule overruns are a defining challenge. Projects are not meeting their intended objectives, and they are not delivering expected business value.
Projects are also beginning to have a greater impact on shareholder value. This has raised the stakes and made it necessary to find a way to manage projects more effectively.
The answer lies in the data. Organizations can use data to make the best possible decisions, not just reactive ones. They can identify and fix potential issues before they turn into project-crushing overruns. That is the promise of project analytics.
Project analytics is the practice of systematically analyzing data to obtain information that helps you make better decisions. By applying statistical models to your data, you can gain key insights that you wouldn't be able to otherwise.
In an environment where projects are becoming more complex, project analytics is a lifeline for project managers who need to stay on schedule and on budget. Using analytics, project managers can move beyond simply capturing data. They can see exactly how projects are performing, and whether they are delivering intended business benefits. Project analytics can also be predictive, giving you insight into what is likely to happen on a project and informing the best actions to take.
Project analytics is a valuable tool for project managers to make strategic decisions and improve project success rates.
A data problem = a project analytics opportunity
The volume of data in the world continues to climb at a remarkable pace. By most current estimates, roughly 90% of the world's data has been created in just the past two years, and the global datasphere reached about 149 zettabytes in 2024, with projections to hit roughly 181 zettabytes by the end of 2025.
This trend holds true when it comes to capital projects. Technology has enabled more complex projects to be executed by more people from more places. And with digitalization, more and more data is captured throughout the project lifecycle.
With the boom of data creation, most businesses have come to a logical conclusion. There has to be a way to use all of this data to improve performance. In construction, leaders are already acting on that conclusion: KPMG research cited by industry analysts found that about 45% of construction organizations now use basic analytics, another 45% are in the process of implementing digital analytics technologies and 68% have deployed or intend to deploy more sophisticated analytics solutions.
The leaders in the industry clearly see project analytics as an opportunity, but are they capitalizing?
Where are we now? The status quo
More data is captured about a project than ever before, but there is limited access to real-time insights, so the value remains untapped.
The inability to quickly and efficiently report on project progress means many companies are only doing backward-looking reporting. For generations, project teams have used data to produce reports that describe what happened.
When I first joined the project controls world, my mentor told me "It's not your job to tell them the license plate of the bus that hit them, but to tell them that the bus is coming."
— Garrett Fultz, Senior Managing Director, FTI Consulting
The project is analyzed at its completion in an attempt to determine how to improve the next time around. However, there often isn't a clear picture of why a project performed the way it did, or what can be done about it.
Overall, the use of data has not been good enough. Consistently high project performance requires better use of project analytics to catch issues before they arise.
The benefits of project analytics
When applied effectively, analytics can have a significant impact on project outcomes. Project analytics can help deliver value in a variety of areas, including the following.
Benchmarking
Project analytics helps you evaluate project performance against both internal and external datasets. You can evaluate your organization against internal factors, such as project team, department or business unit, or benchmark it against industry peers. As you capture more information about projects, you can analyze more dimensions to find areas for improvement.
Forecasting accuracy and predictability
Anybody can tell you at the end of the project how it performed in relation to the original budget and schedule. But the real value is how early in the project you can accurately forecast the outcome. Project analytics can identify issues earlier in the project, giving you an opportunity to take corrective action. By avoiding late surprises, you will be able to avoid overruns.
Time-series analysis
Project analytics also helps you identify trends over particular time periods. You can see whether you are improving over time relative to a specific set of variables. This can be helpful in determining whether new standards or process adjustments are having intended impacts.
Ad hoc analyses
Often, decision makers face a specific challenge or question that needs to be answered. Project analytics supports decision makers with answers to specific questions when they need them, providing the evidence needed to make decisions more confidently.
5 levels of project analytics maturity
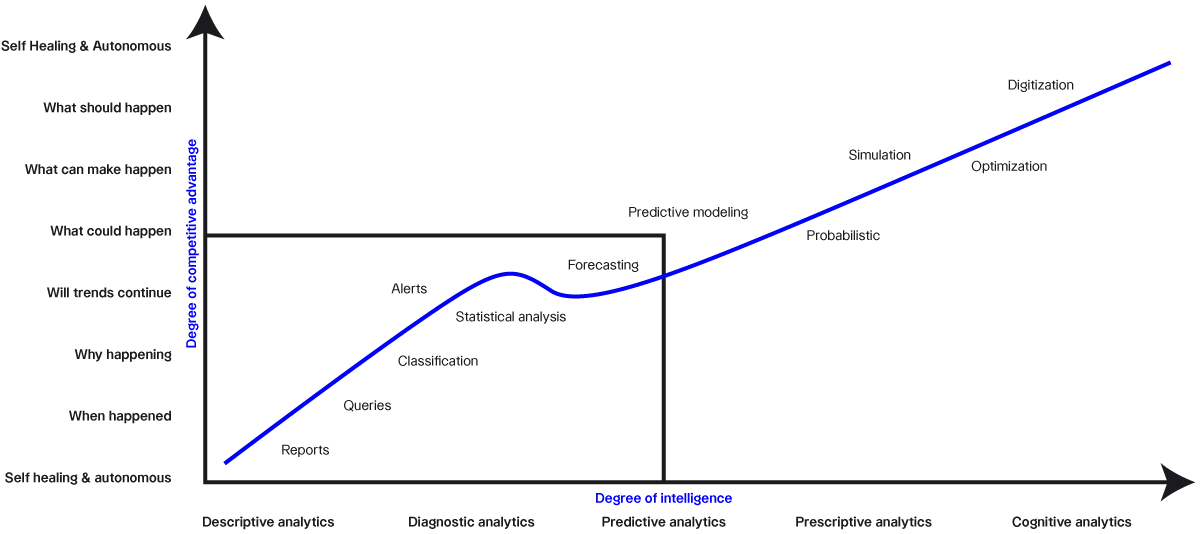
Project analytics exists to help you answer questions. As project analytics practices mature, more complex questions can be answered. Let's take a look at the five levels of project analytics maturity.
1. Descriptive analytics
The first level of maturity is descriptive analytics. This level can do backward-looking reporting, answering basic questions like what happened? Or when did it happen? Most of the reports that businesses generate fall in this category. It is the status quo discussed earlier.
2. Diagnostic analytics
The next level is being able to analyze past performance and answer why did it happen? If you can effectively gather project data, analytics can help you interpret it, identify anomalies, detect patterns and determine relationships between things like cost and performance.
3. Predictive analytics
This level is where you begin to get forward-looking, answering questions like what will likely happen? Applying statistical analysis and predictive models can use past performance to determine likely outcomes for the future. These early warning signs help decision makers prevent a small issue from becoming a large one.
4. Prescriptive analytics
The next level takes the information provided by predictive analytics and uses it to answer the question what should we do? This is continuous automated improvement, meaning that as you implement corrective actions and measure the impacts of those actions, the statistical model can learn from those outcomes to suggest the best path forward.
5. Cognitive analytics
As you apply the previous levels of analytics, you can begin to get very sophisticated and answer questions like what don't we know? This involves using machine learning and artificial intelligence (AI) to have your statistical models define new models.